Help social media managers measure social performance
How can social media managers get an all-encompassing view of company’s social efforts.
Overview
Statusbrew Reporting is a part of the Social Media Management application, that provides analytics to Social Media Managers for their company’s social profiles, individually and in groups. Given the role of the ux designer, I was responsible for coming up with strategies and further designing reporting web application. The primary goals was to measure the success of user’s or company’s campaign against metrics such as the number of likes, impressions and engagement their post received.
Responsibilities
I was the sole UX designer and researcher working on this product right from scratch by strategizing, conceptualizing, designing and delivering the hand-offs to the developer working for multiple platforms.
My primary responsibilities included defining the product strategy, the vision for the product, wireframing, low fidelity designs to prototyping high fidelity designs,naming conventions for each widget for easy development and collaborating with the product manager, CTO and developer by managing the entire design lifecycle in bringing out the product live.
To come up with new product through which a company can get an all-encompassing view of their social efforts and how their engagement translates into business success. The idea was to enable users to analyze every aspect of their social media activity and track ROI.

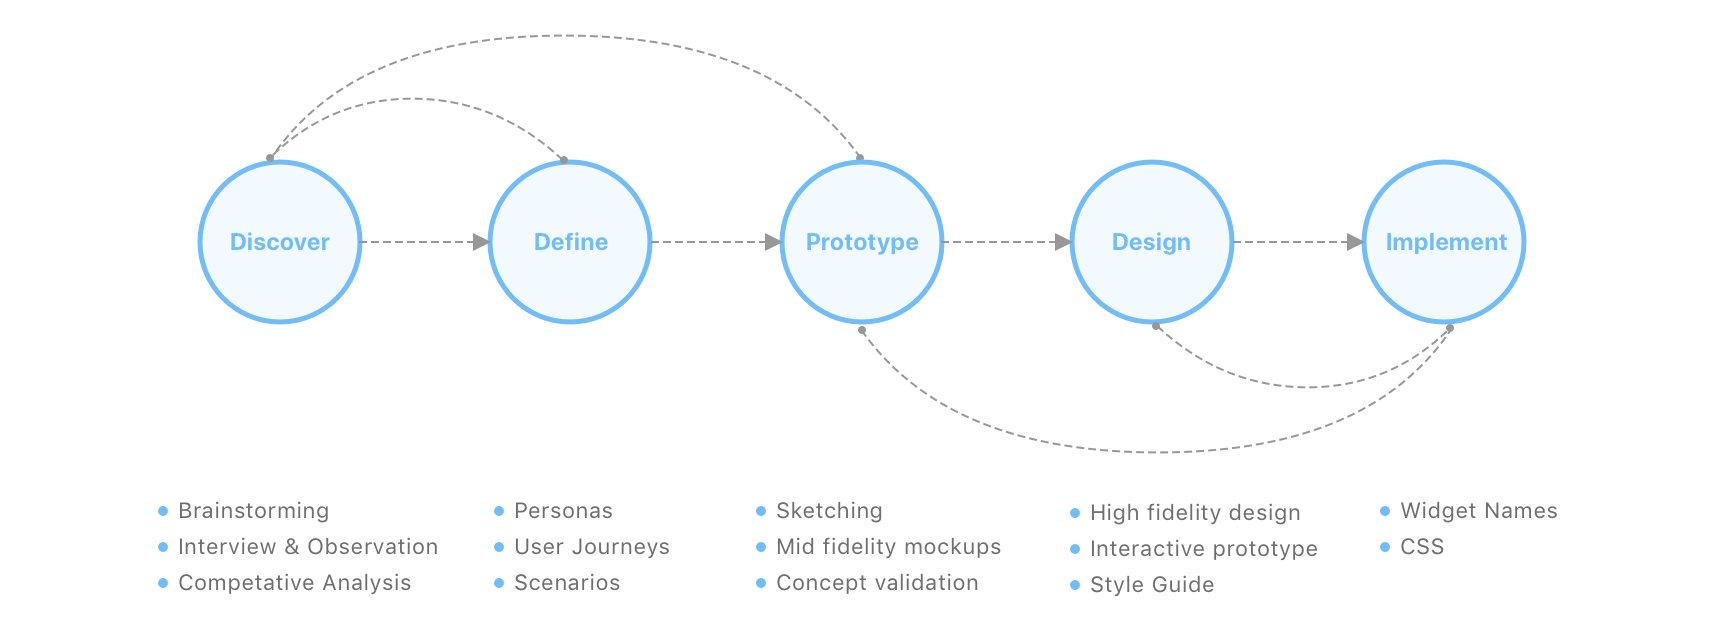
Process
The product was meant to reach the users as soon as possible since this was the first version of the product and increasing customers demanding a platform to analyze their social media activity demanded a need for it. Hence, the iterative agile methodology was defined to bring out the product quickly. Each step of the process was very quick and at its best pace contributing to the development of the product.
Understand
Understand how social media managers, influencers currently analyze company’s social media performance. I talked to some of our clients and product managers to understand the goals of the reports generated from reporting section.
The users of this platform are Social Media Influencers and companies who face difficulty in measuring the effectiveness of their Social Media efforts and how much Return On Investment (ROI) a tweet or post on Facebook has generated for their business. Users who are running social media campaigns on more than one social sites and want to have a thorough look at how all posts are performing on different social media channels quickly.

User Research
I collaborated with the support and marketing team to understand our core users, their environment and major tasks to accomplish. We interviewed a few users by scheduling calls and gathered data on their current workflow and major challenges. This data helped me in finding opportunities to solve the problems.
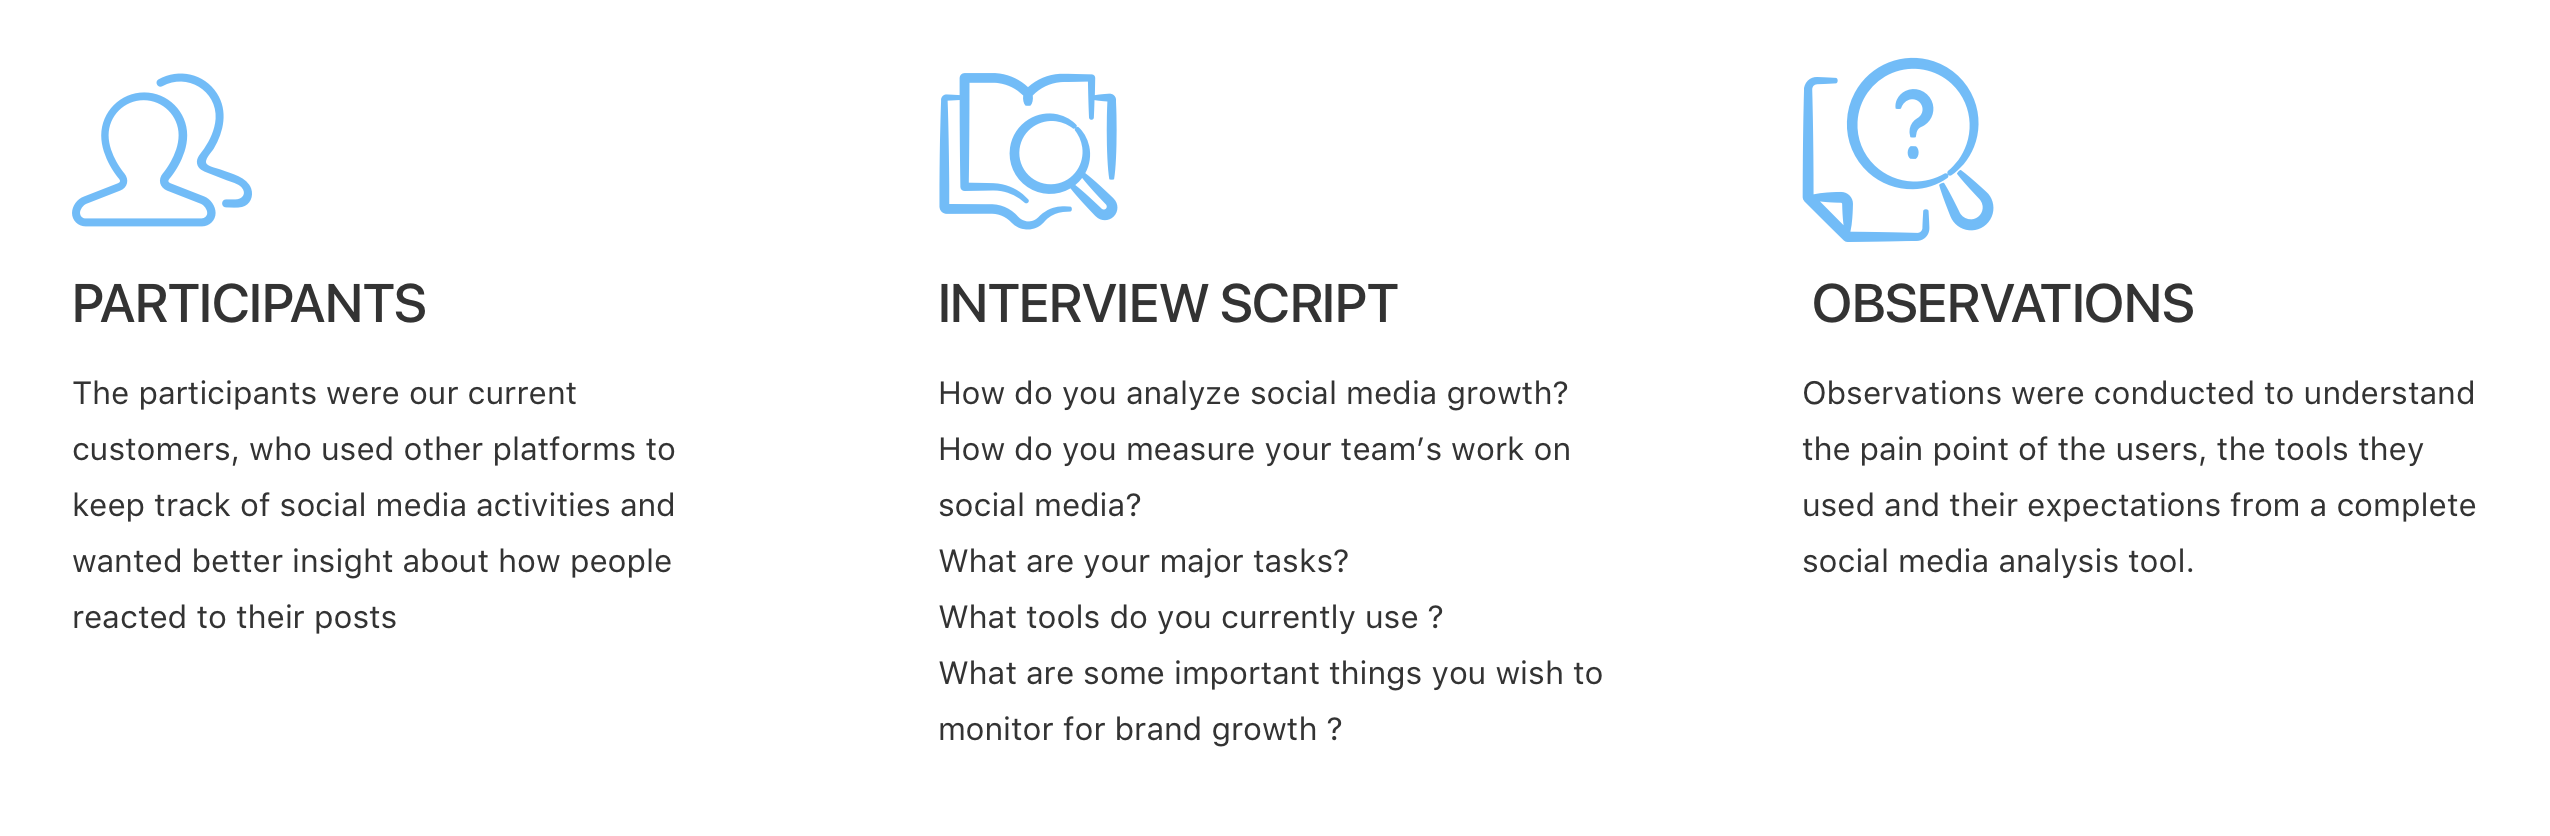
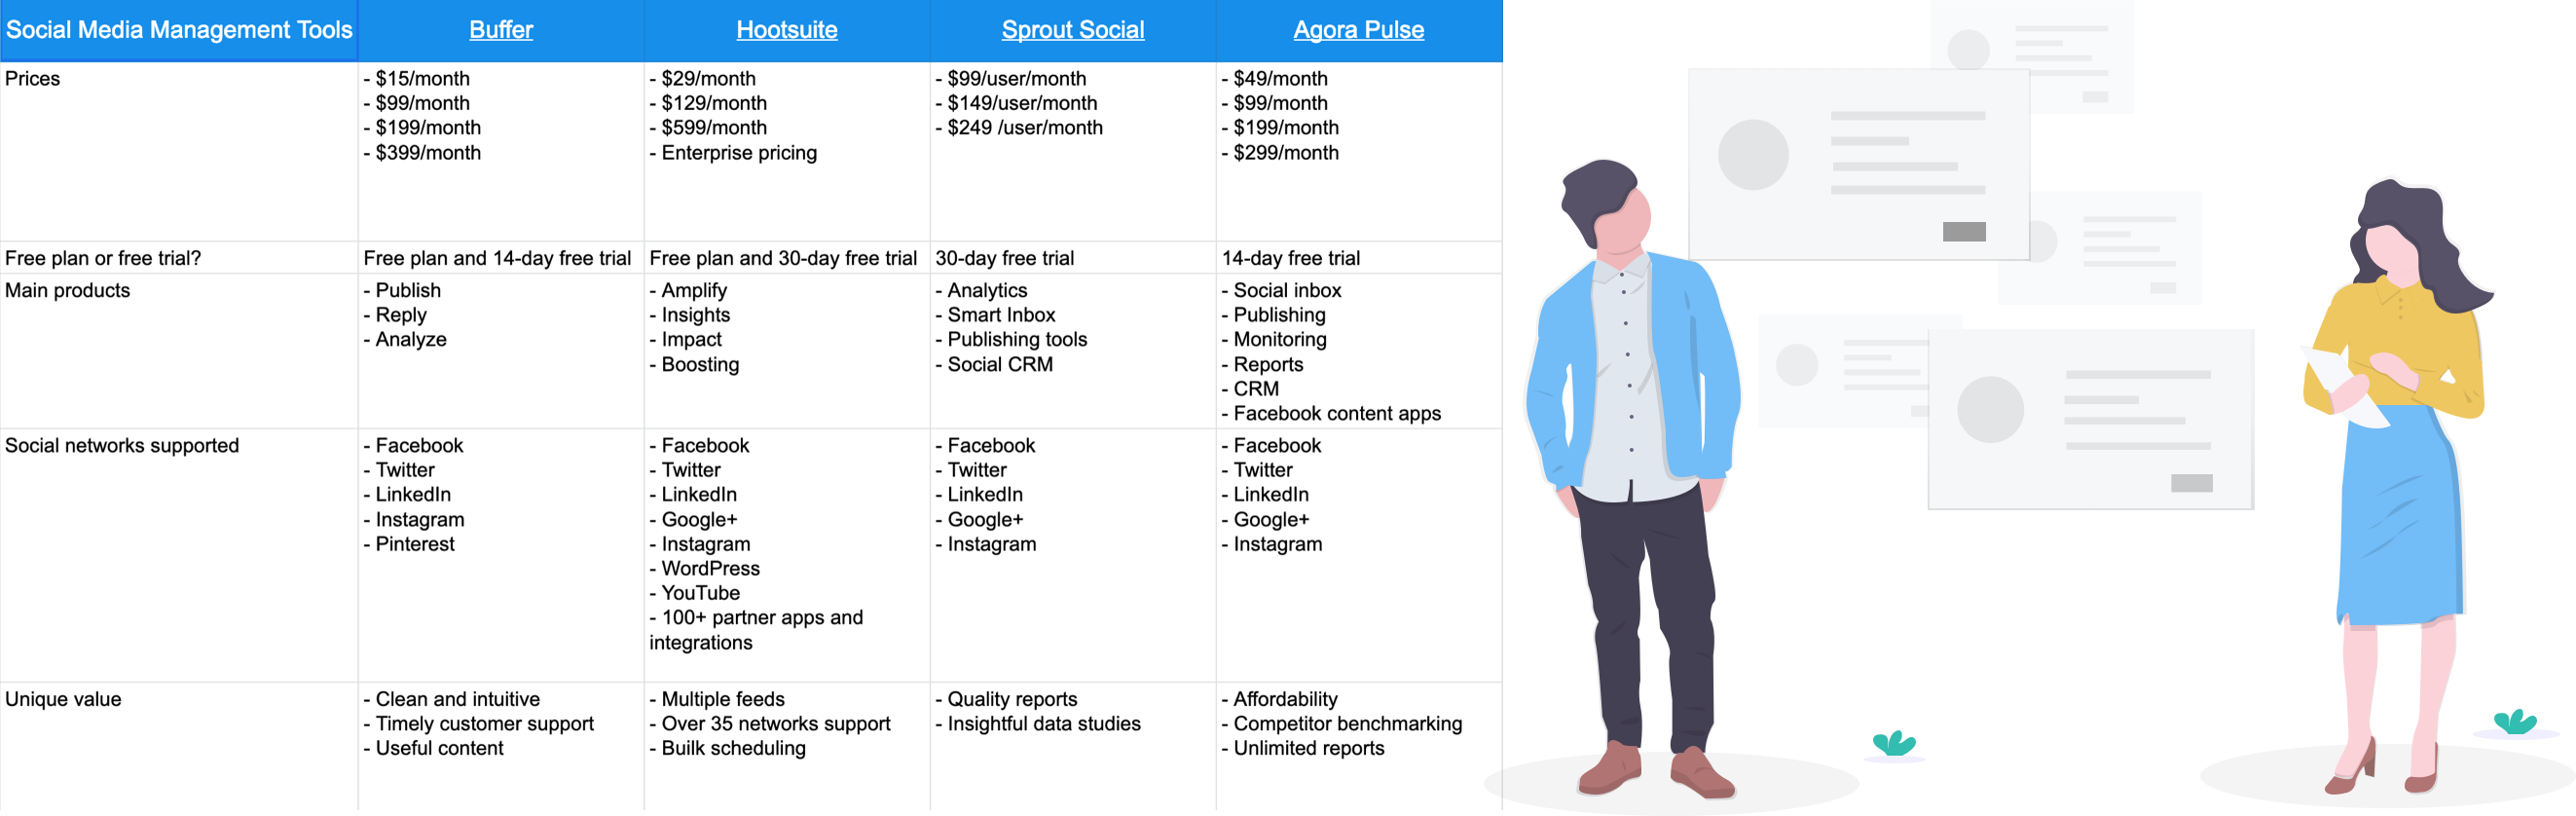
After conducting interviews and observations, I did competitive analysis to understand what our competitors provide and why. I wanted to analyze what the genre of users they target and what they do to satisfy user goals.
Design
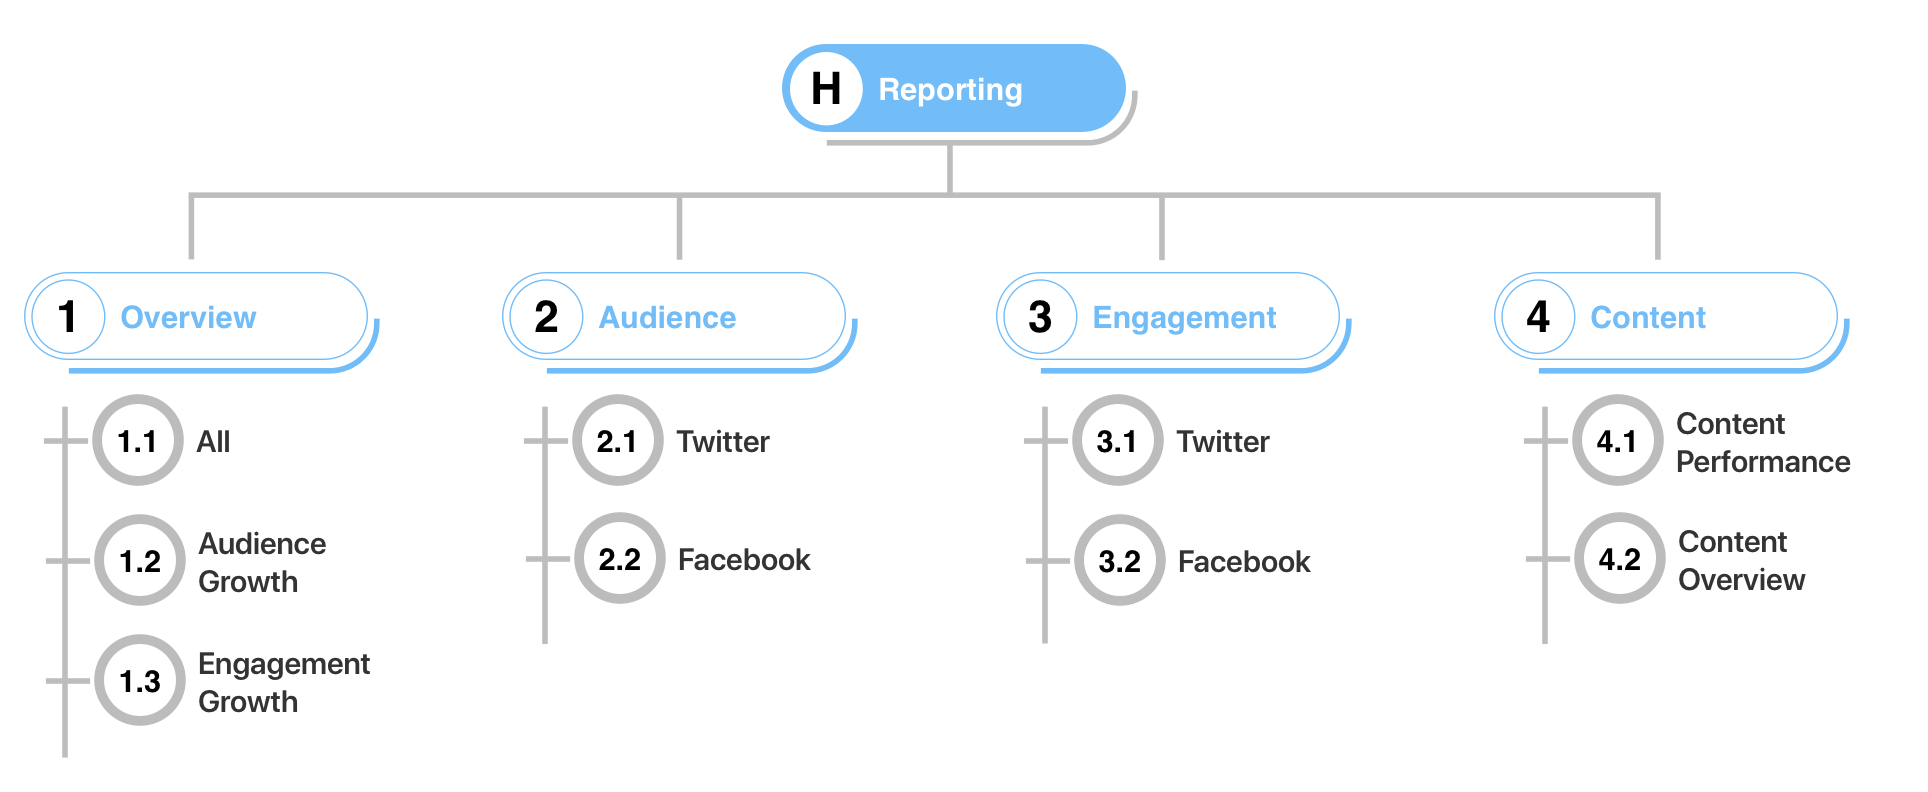
In order to define the hierarchy and make things clear to the development team, in the conceptual design phase I made the site map for the application. I layed out the main sections of the application and what each section will comprise of. Further each sub section was broken down into widgets and a complete list of requirements was made about what each widget will comprise of.
Build
This is the overview of the few designs that I created as a part of the entire reporting project. I made sure that each widget is given a name that can be used by the developers to easily build this. I documented each page, filters under and also the widgets under each page.
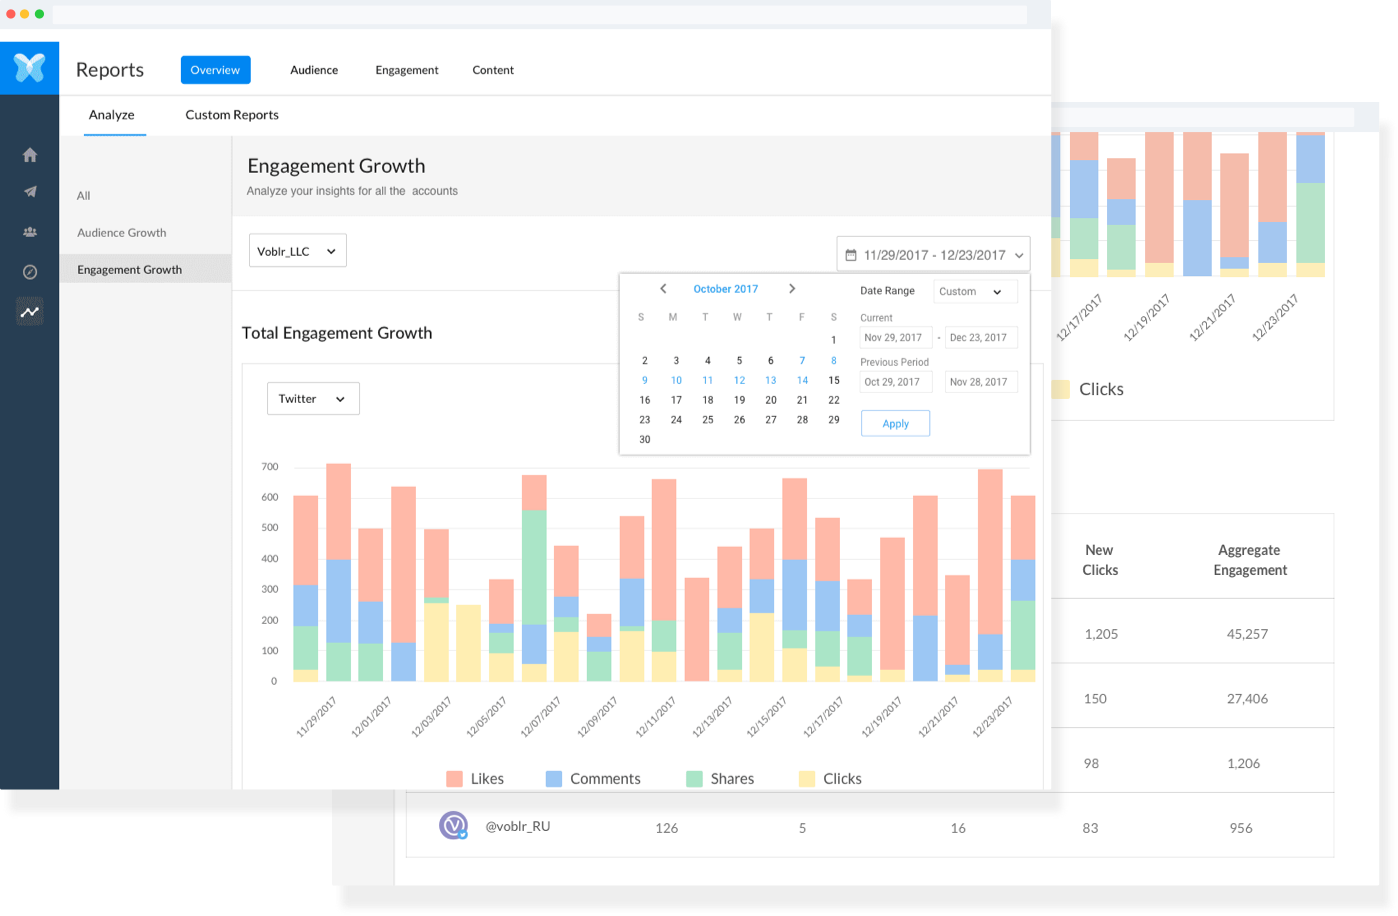
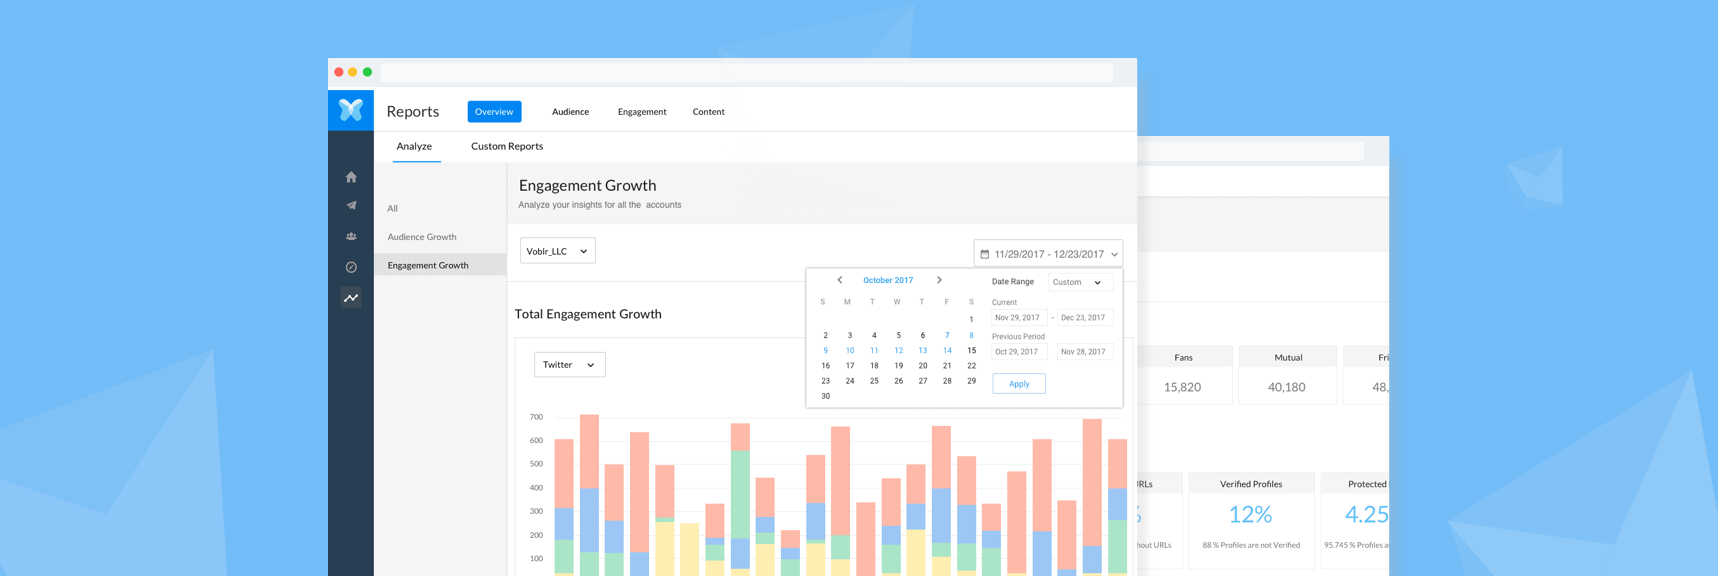
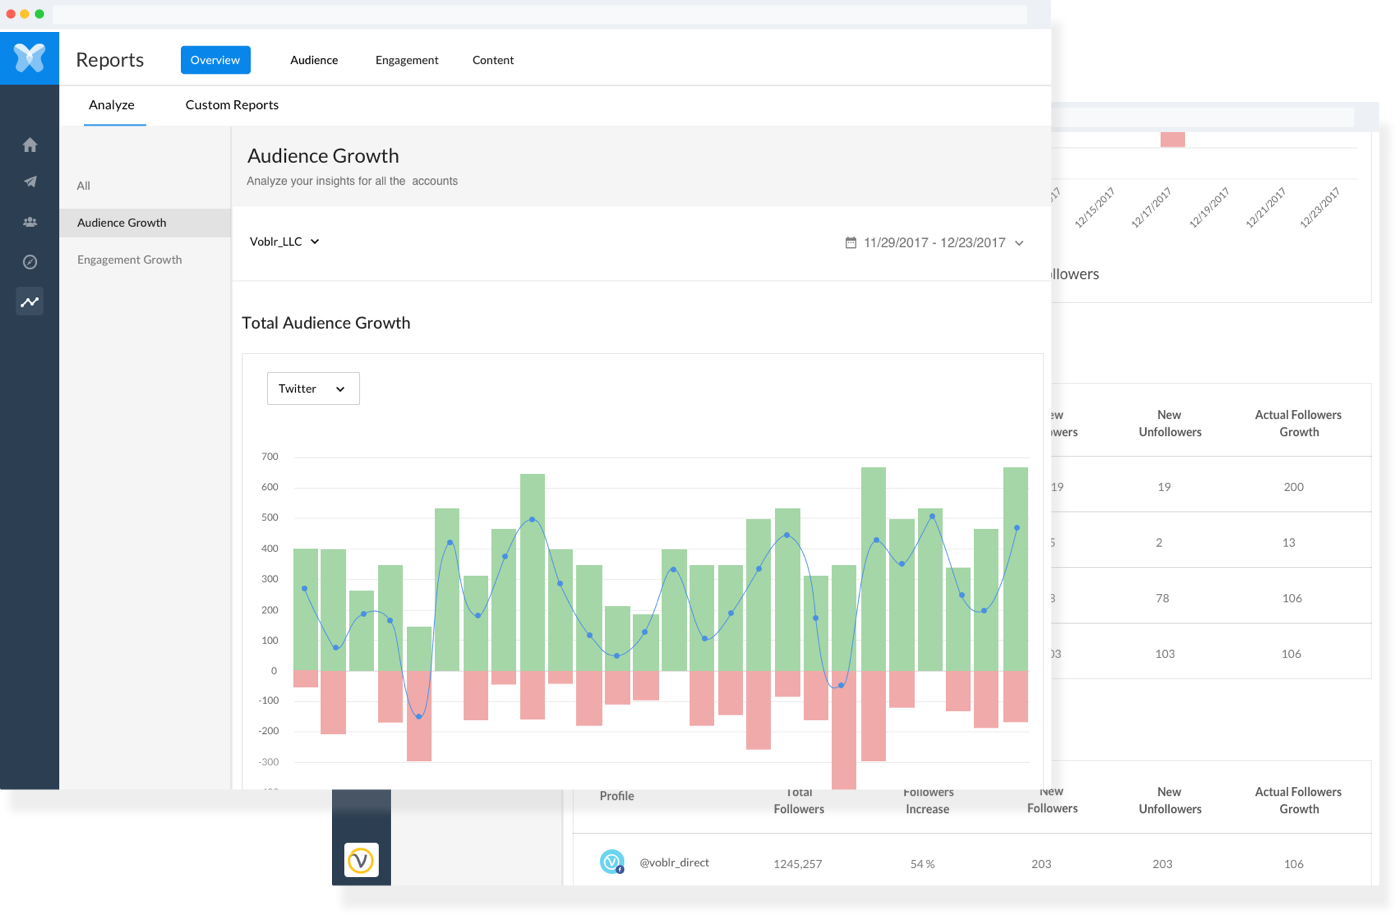
Engagement growth screen helps user cut through the noise on Social, understand the real pulse of their audience. The purpose is to analyze the trends in follower's growth, understand what kind of content works better and measure the engagement.
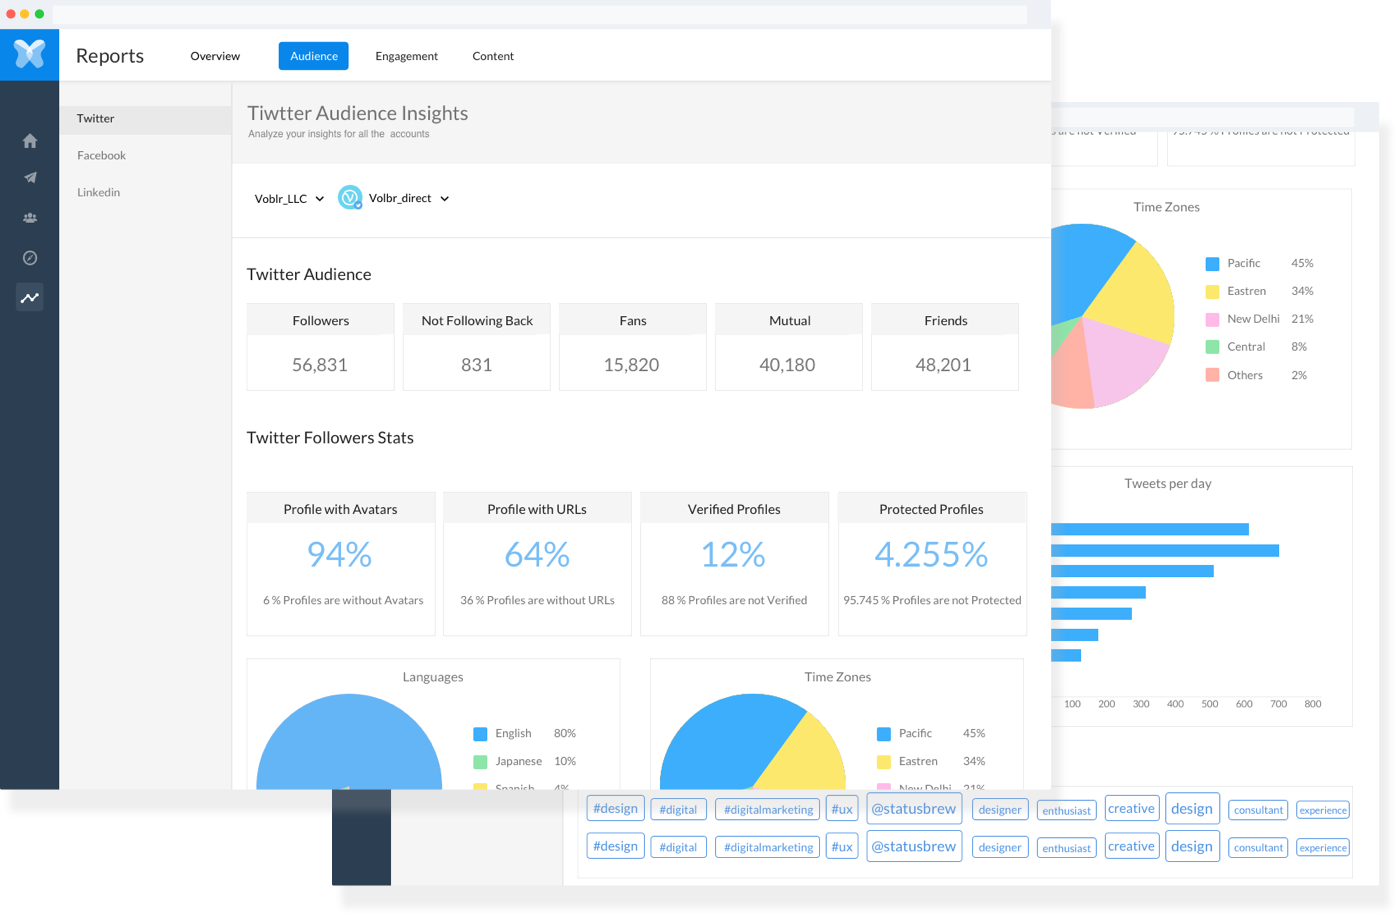
Engagement audience screen contained the analytics for demographics of the various Twitter and Facebook profiles. The main aim here was to communicate the characteristics of the different audience personas that were a part of their social media following. Knowing their interests, it would be easy for the user to create content for their social media profiles.
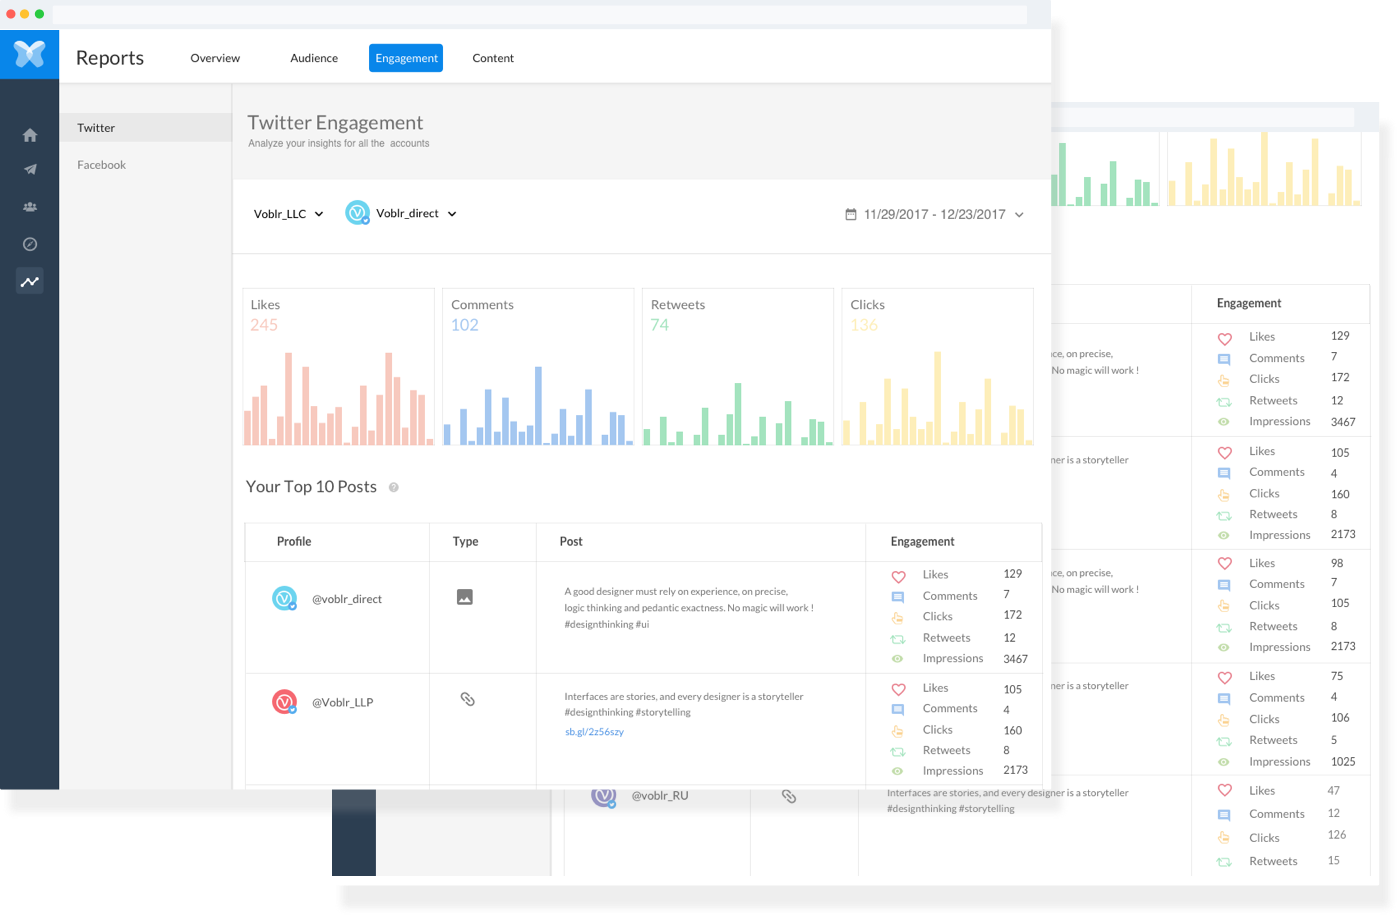
Engagement screen helps user to analyze how his post is performing on different social media channels such as Twitter and Facebook. The engagement section shows number of likes, share, comment, impression and clicks your post is getting.
Engagement analyze screen The content section helps user to evaluate how his posts are performing on different social media channels. It gives a detail report about how many peoples have liked, clicked, commented and shared his post
Reflections and Takeaways
I got a chance to work solely on end to end web analytics platform with a huge customer base. It was a complete data analysis and data visualization task, where each graph had a reason.
- Talking to Real Users - I talked to our actual customer base and found out what they expected. I was able to narrow down the features for the first version of the product by learning about the users and their goals they want to achieve on using the product
- Time management - I worked with the lead developer to make sure things go in the right direction. I defined the component name for each widget which can be used while creating the component.
Additional Discussions
Points which were not discussed in case study but can be discussed in person
User testing and Evaluation
Sketching and variations
Design critique and feedback
Product strategy and timeline